SALES UPDATE FOR WEEK ENDING AUGUST 1ST
The Nielsen and MHW partnership continue to provide you with the latest weekly update for beer, wine, and spirits sales in Nielsen measured off premise channels along with our commentary. Again, please note that this represents retail sales in certain key off premise trade channels – not ALL trade channels. As you all know, while the on premise had begun to re-open to varying extents across the country, there have been pauses and/or retreats more recently, and so off premise volume growth will have to still be very significant to offset on premise declines vs year ago. We’ll be watching these shifts carefully along with our on premise partners (Nielsen CGA). As always, a reminder that this also represents a total category view – and we recognize that the impacts on individual companies within the alcohol industry are not equal.
TOTAL BEVERAGE ALCOHOL
Unless otherwise noted, all trends below are for Nielsen off premise channels for the week ending 8/01/20 compared to the same week in 2019. We continue to remind our readers that we measure sales in specific off premise channels, and that the impact of the health crisis on sales is uneven across companies in the alcohol industry.
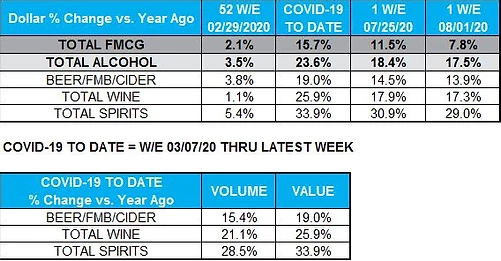
For the latest week ending 8/1/20, total fast-moving consumer good sales growth dropped to single digits, up 7.8% compared to the same week last year. Off premise alcohol growth slowed some, but remains in double digits, up 17.5% compared to last year. Total off premise alcohol sales are up 23.6% for COVID YTD (first week of March through the week ending 8/1/20). Spirits growth led for the latest week, up 29.0%, followed by wine up 17.3%, and then beer/FMB/cider up 13.9%. Core beer (excluding ‘beyond beer’ segments such as hard seltzers and FMBs) was up 7.8%.
ON PREMISE
Visitation to bars/restaurants for eating and drinking occasions remains flat for the previous two weeks: 42% have been out to eat in the past two weeks and 15% have been out for a drink. With visitation remaining fairly flat it appears we have plateaued out on those consumers willing to return to the on premise before the situation improves. Therefore, outlets may need to look at fresh approaches to reaching out to those who have not returned.
Visitation for eating by age once again reveals a fairly even split across demographics, revealing that the vulnerability of age does not appear to be a contributing factor to concern over visitation. Drinking occasions for younger people have fallen though, as bar closures have an impact. Both drinking and eating occasions are increasing in New York but are beginning to decline slightly again in Florida (for eating) and Texas (for drinking).
BEER/FMB/CIDER
In a shift from initial COVID months, beer/FMB/cider in the convenience channel is outpacing growth of larger channels for the fifth consecutive week. For the week ending 8/01/20, beer/FMB/cider grew 16.7% in the convenience channel, while the larger channels of Nielsen xAOC measurement universe (food, drug, mass, club) lagged, up 9.9% in dollar growth compared to the same week last year. This is a reverse in trends from the earlier months of COVID, when consumers were stocking up at grocery and other large-format stores. During the early stages of COVID, growth rates of the grocery channel were close to double the growth rates of the convenience channel. The bounce back of c-store, which of course is beer’s most important channel, is another sign that consumers have settled into a “next” normal.
BEER/FMB/CIDER ACROSS KEY BEER STATES
This week we looked at beer performance in a few key beer states across the country to see where segments and brands are underperforming and overperforming. A note that this analysis is looking at Nielsen xAOC measurement universe, which does not include the convenience channel. In this case, the beer/FMB/cider category grew 9.9% in Nielsen xAOC for total U.S. As a comparison, I looked across the xAOC channel in California, Illinois, Texas, Ohio, Florida, and New York. So, which states are outpacing total U.S. growth? California leads at +14.3%, followed by Florida at +10%, then Ohio +8.2%, New York +6.4%, Illinois +5.7%, and finally Texas +4.8%.
What are the primary growth drivers in each of these states? Let’s start with California. The #1 growth driver is hard seltzer, which isn’t exactly a surprise.
However, the magnitude of growth is impressive. Hard seltzers contributed to 70% of the category’s growth in CA for the latest week. Hard seltzers represented the top 4 growth brand extensions in CA. The second strongest growth segment in CA was craft beer, up 15% compared to the same week last year, with Sierra Nevada’s Hazy Little Thing driving growth in its home state. Imports and super premium segments were also strong contributors.
Some other trends to mention:
- Hard seltzers growth rates lagged in IL and NY (although still up very strong double digits in both of those states)
- Craft growth slowed a lot in IL, FL, and New York
- Mexican imports performed strongest in IL, but had the toughest declines in NY
- White Claw assorted #2 was the top growth brand extension in 4 of the 6 states.In Illinois Mich Ultra topped the list, while in Texas Truly lemonade mix came in as the top growth brand for the week.
SPIRITS
Spirits continue to lead growth, up 29.0% in Nielsen off premise for the latest week ending 8/01/20 compared to the same week last year. Ready-to-drink cocktails once again holds the title of fastest-growing segment, up 100% in off premise dollar sales. Cognac and tequila, up 67.3% and 64.3% respectively, continue with strong off premise growth, given their previously strong presence in on premise, which has shifted to off premise. Whiskey is still the strongest actual contributor to growth, accounting for 32% of total spirits growth; however, growth rates lag the category, up 27.6% compared to last year.
Tequila is growing at a phenomenal pace in off premise channels, and it is also taking share from other top categories in spirits. For COVID year-to-date (the beginning of March through 8/01/20), tequila has gained 2.2 share points in spirits in off premise channels, and gained 2.6 share points for the latest week of data compared to that same week last year. It isn’t slowing down. Tequila’s growth during COVID is fueled by multiple factors:
- The first is tequila’s growth trajectory prior to COVID. Tequila was thefastest-growing category in on and off premise before COVID, and thattrajectory hasn’t changed.
- The second is tequila’s strong presence in the on premise, which now has shifted to the off premise, as drinkers are seeking that same tequilaexperience, but at home.
- The high end is also fueling growth. Prior to COVID, the ultra premium price tier of tequila was the fastest-growing tier in tequila, and that trend continues during COVID in off premise channels.
- While the long tail of tequila is increasing its presence in the category, there are still just a few brands that are driving most of the growth dollars. For the past five months (COVID YTD), the 5 top growth brands in tequila accounted for nearly 60% of the category’s growth in off premise.
WINE
For the week ending 8/01/20, the wine category was up 17.3% in Nielsen off premise channels. Table wine was up 13.6%, lagging total category growth, whereas sparkling wine grew 32.8% in off premise channels, far outpacing total category growth rates. For the latest week, table wine lost 2.7 share points compared to the same week last year, while sparkling wine and wine-based cocktails picked up share, (+1.2 and +0.7 share points respectively). Wine-based cocktails are nearing triple-digit growth rates again, up 93.6% in off premise dollar sales compared to last year.
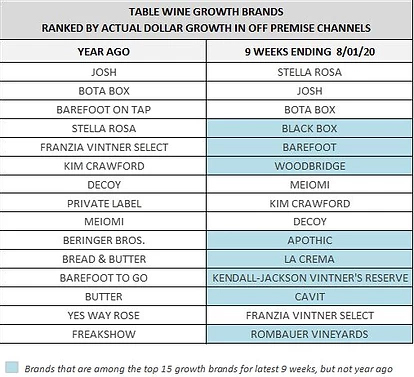
With partial re-openings of on premise beginning in various parts of the country in late May, the summer months of June and July have represented the phase of the “next” normal for COVID and alcohol beverages. So we wanted to take a look at how brands are performing across table wine during this next normal. In the list below, the column on the left represents the top 15 growth brands in table wine for June and July of 2019 (9 weeks ending 8/03/19). The column on the right represents the top 15 growth brands for June and July of this year (9 weeks ending 8/01/20). Growth brands are ranked by actual dollar change in Nielsen off premise channels.
The top 15 growth brands for the latest 9 weeks are contributing more overall dollars to the wine category, compared to the top 15 growth brands last year during this same time period. This year’s growth brands account for 26% of table wine dollars, whereas last year’s 15 growth brands accounted for 10% of table wine dollars in off premise channels. More than half (8) of the growth brands for this year were not on the growth brand list last summer. These brands represent the shift to large sizes and boxed wine, as well as some large and iconic brands in wine. It also represents a shift away from private label, which was on the growth brand list for 2019, but not for latest 9 weeks.